
Average Days on Market Across Chicago and Chicagoland Suburbs
If you are thinking about selling your home in the Chicago area, one of the first questions you probably have is: how long is this going to take? The answer depends a lot on where you live, what time of year it is, and the condition of your home. In some parts of Chicagoland, homes sell in under two weeks. In others, they can sit on the market for two months or more.
This article breaks down average days on market (DOM) data for Chicago and eleven of its suburbs, explains what drives those numbers, and shows you how different selling methods can affect your timeline.

What Is Days on Market?
Days on market, often shortened to DOM, is the number of days a home is listed for sale before the seller accepts an offer. A lower DOM generally means the market is competitive and buyers are acting fast. A higher DOM can mean inventory is high, prices are stretched, or the home has issues that slow things down.
It is important to know that DOM counts the days until an offer is accepted, not until closing. After a buyer and seller agree on a price, there is still a closing process that typically takes 30 to 60 days for a traditional financed sale. So when you see a home listed as selling in 30 days, the full process from listing to getting your money could be closer to 60 to 90 days.
Also worth noting: different sources measure DOM slightly differently. Some count calendar days, some count business days, and some stop the clock at contract signing while others count through closing. The data in this article uses the most widely reported measure, which is days from listing to accepted offer or pending status.
Chicago and Chicagoland: The Big Picture
The Chicago metro area is one of the largest real estate markets in the United States. Home prices and selling timelines vary widely depending on whether you are in the city itself, a close-in suburb, or a more rural area farther out.
According to Illinois REALTORS, homes in the Chicago metro area were on the market for an average of 29 days in May 2025, up slightly from 28 days the year before. The City of Chicago itself saw homes average 33 days on market during the same period. [1]
The Chicago Association of REALTORS reported that in September 2025, city listings averaged 56 days on market until contract, a 5.7 percent increase from September 2024. [2] This is important context: the DOM figure changes significantly depending on the season. Spring and summer bring faster sales. Fall and winter slow things down considerably.
Home prices in the city have continued to rise. The median sale price in Chicago was $355,000 as of January 2026, up 1.4 percent year over year. [3] The median sale price in September 2025 was $461,000, reflecting how much prices vary across seasons and neighborhoods. [2]
DOM by Area: Chicago Neighborhoods vs. Suburbs
The gap between hot neighborhoods and slower ones can be dramatic. In some fast-moving Chicago neighborhoods on the Northwest Side such as Avondale and Hermosa, homes were selling in an average of just 19 days in the third quarter of 2024. [7] Meanwhile, homes in the Downtown Chicago area were averaging closer to 77 to 78 days on market. [4]
The type of home matters too. Condos in Chicago were selling faster than single-family homes in some recent reporting periods, with condo DOM dropping about 13 percent year over year as of mid-2025. [5]
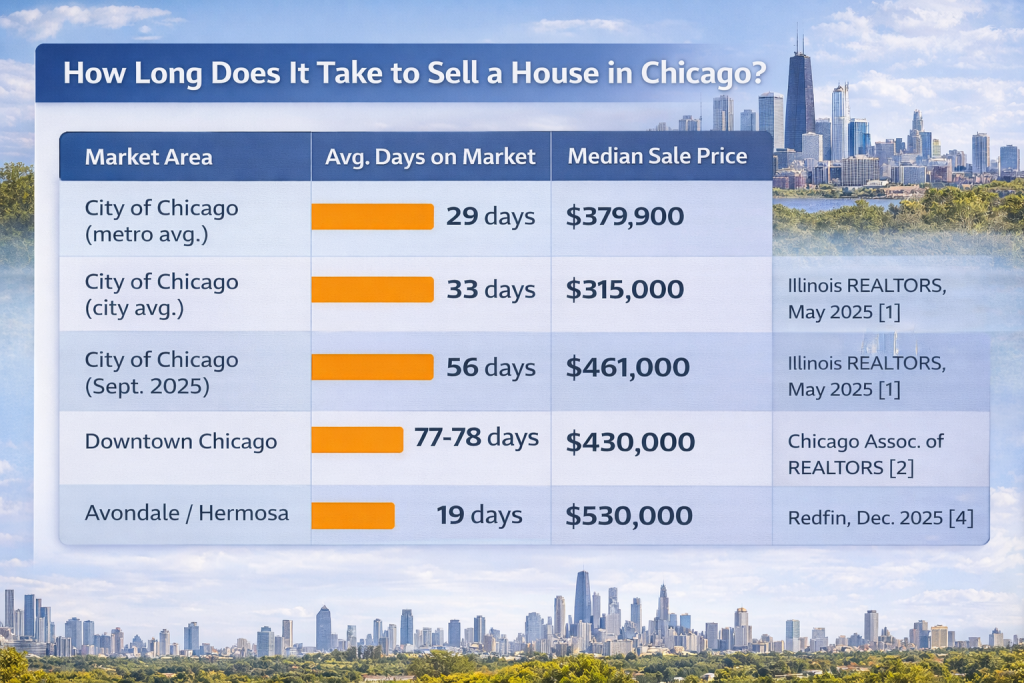
Here is a look at the overall Chicago city and metro area data before diving into individual suburbs:
| Market Area | Avg. Days on Market | Median Sale Price | Source / Period |
|---|---|---|---|
| City of Chicago (metro avg.) | 29 days | $379,900 | Illinois REALTORS, May 2025 [1] |
| City of Chicago (city avg.) | 33 days | $315,000 | Illinois REALTORS, May 2025 [1] |
| City of Chicago (Sept. 2025) | 56 days | $461,000 | Chicago Assoc. of REALTORS [2] |
| Downtown Chicago | 77-78 days | $430,000 | Redfin, Dec. 2025 [4] |
| Avondale / Hermosa | 19 days | $530,000 | @properties, Q3 2024 [7] |
Note: DOM figures vary significantly by season. Spring and summer numbers are lower; fall and winter numbers are higher.
Suburb-by-Suburb Breakdown
Each suburb has its own market conditions. Here is what the data shows for the communities Big Door Home Buyers serves across Chicagoland.
Aurora, IL
Aurora is the second-largest city in Illinois and one of the most active real estate markets in the Chicago suburbs. The market here has been extremely competitive in recent years.
In March 2025, the median days on market in Aurora was 13 days. [9] In the summer of 2024, Aurora was even faster, with homes selling in as little as 7 to 8 days on average. [10] The list-to-sold price ratio has been running at or above 100 percent, meaning homes routinely sell at or above asking price. [9]
Redfin data places Aurora’s median DOM at around 51 days when measured over a longer period, which includes slower winter months. [6] The median home price in Aurora is approximately $332,000, up 10.7 percent year over year. [6]
For sellers in Aurora, the market is strong but condition and pricing still matter. Homes that need significant work or are priced too high will sit longer than the average.
Joliet, IL
Joliet is one of the fastest-growing cities in Illinois and has seen strong price appreciation. However, DOM data here shows more variation than some other suburbs.
Redfin reports that homes in Joliet sell in around 59 days on average as of late 2025, up from 47 days the year before. [12] Movoto data from January 2026 puts the median at 42 days. [13] Rocket Homes data from June 2025 found that 83 percent of Joliet homes sold within 30 days during that peak season month, with an average listing age of just 17 days. [14]
The median sale price in Joliet was $306,000 in November 2025, up 10.1 percent year over year. [12] This is one of the more affordable options in Chicagoland, which is helping to fuel demand.
Northbrook, IL
Northbrook is a high-end North Shore suburb with strong schools and higher-priced homes. Movoto reports that properties in Northbrook sell after an average of 26 days on market as of September 2025, up from 21 days the previous year. [15] The median sale price in Northbrook was $647,000 in September 2025. [15]
Because Northbrook homes are priced significantly higher than most Chicagoland markets, buyers take more time to make decisions. The downtown Northbrook neighborhood specifically can see longer DOM, with Redfin listing that micro-area at around 102 days. [4] However, the broader Northbrook market is much faster than that figure suggests for the overall town.
Palatine, IL
Palatine is a mid-sized suburb in Cook County. Redfin data shows homes in Palatine selling in around 67 days on average as of January 2026, down from 84 days the year prior. [16] The Redfin compete score places it at around 56 days on the more active side of the market. The median sale price was $329,000 in January 2026. [16]
Palatine offers a mix of single-family homes, condos, and townhomes. The condo and townhome segment can skew DOM numbers, as those property types sometimes take longer to sell than single-family homes in the same market.
Elgin, IL
Elgin sits at the edge of Cook and Kane counties and has a diverse housing stock at relatively affordable prices. Redfin data from October 2025 shows homes in Elgin selling after an average of 56 days on market, up from 50 days the year prior. [11] The median price in October 2025 was $328,000. [11]
HomeLight data lists Elgin’s DOM at approximately 63 days in its broader market analysis. [23] Elgin has a mix of well-maintained move-in-ready homes and older properties that need work, which is one reason DOM varies more here than in tighter suburban markets.
Algonquin, IL
Algonquin, located in McHenry County, has been a seller’s market. Rocket Homes data from May 2025 found that 85 percent of homes sold within 30 days, with an average listing age of just 20 days during that spring peak. [24] The median home sold price was $399,250 in May 2025, up 8 percent from the prior year. [24]
HomeLight’s broader market data places Algonquin’s DOM at around 65 days when including slower seasonal periods. [23] Like most McHenry County communities, Algonquin benefits from relatively affordable pricing compared to closer-in Cook County suburbs.
McHenry, IL
McHenry is a lakefront community on the Fox Chain O’Lakes that draws both primary residents and people looking for a second home feel. Redfin data from January 2026 shows homes in McHenry selling after an average of 63 days on market, down from 73 days the year before. [22] The median sale price was $280,000. [22]
Rocket Homes data from April 2025 found that 75 percent of homes in McHenry County sold within 30 days during the spring market. [21] However, McHenry’s more rural character and lakefront properties mean it attracts a more specific buyer pool, which can lead to longer selling times for properties that do not appeal broadly.
Bolingbrook, IL
Bolingbrook is a large suburb in Will County with strong demand. Redfin data shows homes in Bolingbrook selling in around 53 days on average as of September 2025, up from 47 days the year prior. Homes in Bolingbrook receive an average of 5 offers, which is one of the highest figures in the Chicagoland suburbs. [17]
Movoto data from November 2025 puts the Bolingbrook DOM at 36 days. [18] Prop:Metrics data from October 2025 shows a median of 37 days per Realtor.com. [19] The median home price in Bolingbrook is approximately $370,000. [17]
Crystal Lake, IL
Crystal Lake is one of the larger cities in McHenry County with a vibrant downtown and strong community appeal. Redfin data from November 2025 shows homes in Crystal Lake selling after an average of 52 days on market, down from 59 days the year prior. [20] The Redfin compete score places typical pending time at around 50 days. The median sale price was $378,000. [20]
HomeLight’s data lists Crystal Lake at around 65 days in its broader analysis. [23] Crystal Lake is popular with families and has benefited from relatively stable demand driven by good schools and outdoor amenities including its namesake lake.
Downers Grove, IL
Downers Grove is a well-established DuPage County suburb with strong schools and a walkable downtown. Redfin data from October 2025 shows homes selling after an average of 42 days on market, essentially flat from 43 days the prior year. [25] Movoto data from June 2025 was even more bullish, showing an average of just 14 days during the peak spring-summer season. [26] The median sale price was $437,000 in October 2025, up 6.6 percent year over year. [25]
Downers Grove is one of the stronger performing markets in DuPage County. Its combination of Metra access, top-rated schools, and diverse housing stock drives consistent demand.
Arlington Heights, IL
Arlington Heights is a large and desirable suburb in Cook County with excellent schools and strong transit access. Redfin data from October 2025 shows homes selling after an average of 45 days on market, down from 50 days the prior year. [27] The Redfin compete score gives Arlington Heights a very competitive rating, with hot homes going pending in around 27 days.
Zillow data shows Arlington Heights homes going to pending in around 6 days, reflecting just how fast the hottest listings move. [28] The median home value is approximately $466,880, up 4.1 percent over the past year. Arlington Heights receives an average of 3 offers per home. [27]

Ranges reflect different seasons, measurement periods, and data sources. Spring and summer figures are typically at the lower end of the range. Fall and winter figures are at the higher end.
What Affects How Long Your Home Sits on the Market?
Days on market is not just about geography. Several other factors can push your home’s timeline up or down significantly.
Season and Time of Year
Season is one of the biggest factors in Chicagoland. Spring is the strongest selling season, with mid-April through May typically producing the fastest sales and highest prices. [29] A 2022 ATTOM Data Solutions analysis found that homes sold in May commanded a 12.6 percent premium above market value on average, the highest of any month in the year. [31]
Summer stays active as families try to close before the school year. Fall sees a secondary market of motivated buyers trying to close before the holidays. Winter is the slowest period, with fewer buyers, longer DOM, and more room for negotiation.
According to Illinois REALTORS, spring home listings in Illinois jumped by more than 15 percent compared to the prior winter in 2024, showing the strong seasonal swing in this market. [32]
Home Condition
Homes that are move-in ready sell faster and for more money. Buyers in today’s market, especially those using financing, want homes that will pass inspection and appraisal without problems. A home that needs a new roof, has foundation issues, or has outdated systems will attract fewer buyers and sit longer.
This is especially true at higher price points. In a market like Northbrook where the median price is over $600,000, buyers expect the home to be in excellent condition. A dated or deferred-maintenance property will take much longer to sell or require a significant price reduction.
Price
Overpricing is one of the most common reasons homes sit on the market too long. When a home is priced too high, buyers skip it in favor of better-priced competition. The longer a home sits, the more buyers wonder what is wrong with it. This leads to price cuts and a final sale price that is often lower than if the home had been priced correctly from the start.
According to Baird & Warner, average selling prices in the Chicago area have continued to rise, and homes priced correctly are still selling quickly. [8] The issue arises when sellers price based on emotion rather than comparable sales data.
Inventory Levels
Low inventory speeds up the market. When there are fewer homes for sale, buyers compete for what is available, driving up prices and cutting down DOM. The Chicago area has been dealing with historically low inventory for several years.
According to Resiclub data reported by the Chicago Sun-Times, the number of homes for sale in Illinois between December 2019 and December 2025 dropped by 58 percent. [8] That dramatic inventory drop is a major reason why even in a slower market, well-priced homes continue to sell relatively quickly.
Mortgage Rates
Higher mortgage rates reduce the number of qualified buyers, which can slow sales. The 30-year fixed mortgage rate has been hovering around 6.75 percent as of mid-2025, according to Freddie Mac’s Primary Mortgage Market Survey. [32] This is significantly higher than the sub-3 percent rates of 2020 and 2021, which is one reason buyer activity has moderated.
However, Chicago-area experts note that demand has held up better than in many other parts of the country. The Midwest’s relative affordability compared to coastal markets has helped keep buyer interest steady even with elevated rates. [8]
How a Traditional Sale Timeline Actually Works
Understanding DOM is just one part of knowing how long it takes to sell. Here is what the full traditional sale process actually looks like in the Chicago area.
| Stage | Typical Timeline |
|---|---|
| Prepare the home (repairs, staging, photos) | 2-6 weeks |
| Listed on market to accepted offer (DOM) | 14-76 days depending on area and season |
| Inspection and appraisal period | 1-2 weeks |
| Loan processing / underwriting | 2-4 weeks |
| Closing | 1-2 days |
| Total from decision to sell to cash in hand | 2 to 5+ months |
That total timeline assumes everything goes smoothly. Deals fall through. Buyers lose their financing. Appraisals come in low. Inspections reveal problems that need negotiation. Each of these events can add weeks to the process.
What About Selling for Cash?
For homeowners who need to sell quickly, cannot afford repairs, or simply want certainty, a cash sale offers a very different timeline.
A cash buyer like Big Door Home Buyers does not require inspections, appraisals, or lender approval. The process looks more like this:
| Stage | Cash Sale Timeline |
|---|---|
| Contact buyer / request offer | Same day |
| Receive cash offer | Within 24 hours |
| Review and accept offer | 1-3 days |
| Title work / closing preparation | 7-14 days |
| Closing and payout | As soon as 7-14 days total |
The total timeline from first contact to cash in hand can be as short as one to two weeks. This is especially valuable for homeowners dealing with inherited properties in probate, divorce situations, job relocation, foreclosure risk, or homes that need significant repairs.
The tradeoff is that a cash offer will typically be below what you might get on the open market after a strong spring listing. However, when you factor in agent commissions (typically 5 to 6 percent), closing costs, repair costs, carrying costs during a 2 to 5 month sales process, and the risk of deals falling through, the net difference is often smaller than sellers expect.
Tips for Selling Faster in the Chicago Market
Whether you go the traditional route or a cash sale, here are some things that can help shorten your timeline.
- List in spring if possible. Mid-April through May is consistently the fastest and highest-value window in the Chicago market. [29]
- Price based on comps, not emotion. Ask your agent for recent sold data in your neighborhood, not just active listings.
- Address obvious issues before listing. Even small repairs like fixing leaky faucets, painting, and cleaning up the yard make a measurable difference.
- Use professional photos. Most buyers start their search online. Poor photos mean fewer showings.
- Consider your options. If the traditional route does not work for your situation, a cash buyer can provide certainty and speed in exchange for a lower price.
Conclusion
Selling a home in the Chicago area takes anywhere from a couple of weeks to several months, depending on your location, the time of year, the condition of your home, and how you choose to sell. Fast-moving suburbs like Arlington Heights, Aurora, and Downers Grove see homes go under contract in as little as two to six weeks during peak season. Slower markets and off-season listings can push that well past 60 days.
The full process of a traditional sale, from listing through closing, typically runs 2 to 5 months. For sellers who need speed and certainty, a cash sale can cut that to as little as 7 to 14 days.
If you own a home in Chicago, Aurora, Joliet, Northbrook, Palatine, Elgin, Algonquin, McHenry, Bolingbrook, Crystal Lake, Downers Grove, or Arlington Heights and want to know what a fast cash sale would look like for your property, Big Door Home Buyers can give you a no-obligation offer within 24 hours. Call us at (224) 464-3623 or visit bigdoorhomebuyers.com to get started.
Sources
- Illinois REALTORS, Monthly Home Sales and Price Report, May 2025. illinoisrealtors.org
- Chicago Association of REALTORS, September 2025 Market Snapshot. chicagorealtor.com/september-2025-market-snapshot
- Redfin, Chicago Housing Market: House Prices and Trends, January 2026. redfin.com/city/29470/IL/Chicago/housing-market
- Redfin, Downtown Chicago Housing Market: House Prices and Trends, December 2025. redfin.com/neighborhood/739060/IL/Chicago/Downtown-Chicago/housing-market
- Norada Real Estate Investments, Chicago Housing Market: Trends and Forecast 2025-2026, July 2025. noradarealestate.com/blog/chicago-real-estate-market
- Innago, Illinois Housing Market Trends and Forecast 2024, December 2025. innago.com/illinois-housing-market-trends-forecast
- @properties Christie’s International Real Estate, Fall/Winter 2024 Market Update: Chicago, October 2024. blog.atproperties.com/fall-winter-2024-market-update-chicago
- Chicago Sun-Times, Chicago’s Housing Market Sees More Buyers, January 2026. chicago.suntimes.com/real-estate/2026/01/30/affordability-chicago-housing-market-homebuyers-experts-economists
- The Kombrink Team at One Source Realty, Aurora IL Real Estate Market Update, March 2025. kombrink.com/blog/aurora-il-real-estate-market-update-march-2025
- The Kombrink Team at One Source Realty, Aurora IL Real Estate Market Update, August 2024. kombrink.com/blog/aurora-il-real-estate-market-update-august-2024
- Redfin, Elgin Housing Market: House Prices and Trends, October 2025. redfin.com/city/29477/IL/Elgin/housing-market
- Redfin, Joliet Housing Market: House Prices and Trends, November 2025. redfin.com/city/29490/IL/Joliet/housing-market
- Movoto, Joliet IL Market Trends, January 2026. movoto.com/joliet-il
- Rocket Homes, Joliet IL Housing Market Report, June 2025. rocket.com/homes/market-reports/il/joliet
- Movoto, Northbrook IL Market Trends, September 2025. movoto.com/northbrook-il/market-trends
- Redfin, Palatine Housing Market: House Prices and Trends, January 2026. redfin.com/city/14831/IL/Palatine/housing-market
- Redfin, Bolingbrook Housing Market: House Prices and Trends, September 2025. redfin.com/city/29465/IL/Bolingbrook/housing-market
- Movoto, Bolingbrook IL Market Trends, November 2025. movoto.com/bolingbrook-il/market-trends
- Prop:Metrics, Bolingbrook IL 60440, October 2025. prop-metrics.com/zip/60440
- Redfin, Crystal Lake Housing Market: House Prices and Trends, November 2025. redfin.com/city/4628/IL/Crystal-Lake/housing-market
- Rocket Homes, McHenry County IL Housing Market Report, April 2025. rockethomes.com/real-estate-trends/il/mchenry-county
- Redfin, McHenry Housing Market: House Prices and Trends, January 2026. redfin.com/city/11650/IL/McHenry/housing-market
- HomeLight, Crystal Lake IL Housing Market Trends and Prices. homelight.com/crystal-lake-il/housing-market
- Rocket Homes, Algonquin IL Housing Market Report, May 2025. rockethomes.com/real-estate-trends/il/algonquin
- Redfin, Downers Grove Housing Market: House Prices and Trends, October 2025. redfin.com/city/5322/IL/Downers-Grove/housing-market
- Movoto, Downers Grove IL Market Trends, June 2025. movoto.com/downers-grove-il/market-trends
- Redfin, Arlington Heights Housing Market: House Prices and Trends, October 2025. redfin.com/city/29458/IL/Arlington-Heights/housing-market
- Zillow, Arlington Heights IL Housing Market 2025. zillow.com/home-values/84275/arlington-heights-il-60006
- HomeLight, Best Time to Sell a House in Illinois, August 2025. homelight.com/blog/best-time-to-sell-a-house-in-illinois
- Illinois REALTORS / Institute for Housing Studies at DePaul University, Illinois Housing Market Forecast, March 2025. illinoisrealtors.org/wp-content/uploads/2025/03/Forecast-March2025.pdf
- ATTOM Data Solutions, Best Day to Sell a House Analysis, 2022, via benlalez.com/blog-posts/chicago-real-estate-market-seasonal-home-sale-trends
- Norada Real Estate Investments, Illinois Housing Market Trends and Forecast 2025-2026, July 2025. noradarealestate.com/blog/illinois-housing-market
- Stephanie Turner Chicago, Chicago Real Estate Market Trends for Q3 2025. stephanieturnerchicago.com/blog/chicago-real-estate-market-trends-for-q3-2025